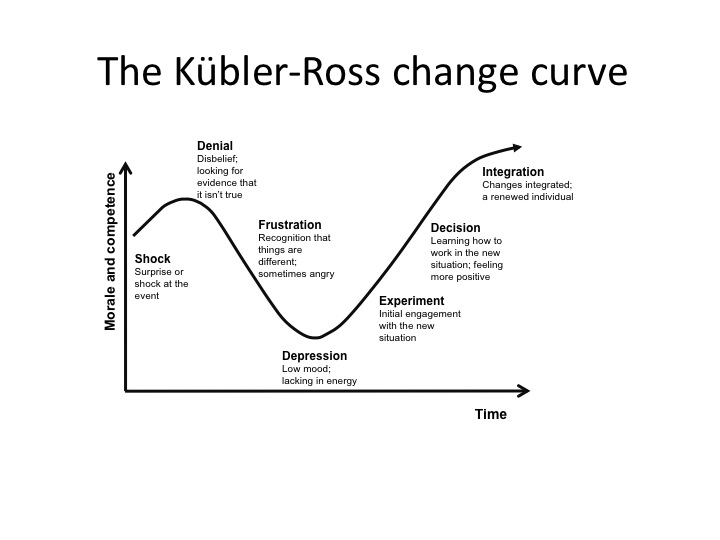
If your organisation’s going through – or about to go through – a change, it pays to follow the curve – the Kubler-Ross change curve*.
Understanding the ups and downs of the ‘change curve’ will help you lead successfully through change and make sure you recognise what people in your organisation will go through. Major changes can spark all sorts of emotions and feelings in people, especially when they’re faced with the unknown. Knowing how to guide them through these feelings will help them travel along the curve and through the change process.
Elizabeth Kubler-Ross came up with the change curve model in 1969 to show what terminal patients go through following their diagnosis, before adapting it to fit any form of personal loss or trauma, including those related to what’s happening in their place of work.
There are five stages in the curve, which we’ll discuss in a bit more detail below and show you how they relate to any sort of change in an organisation.
1. Denial – This is where there’s a refusal to accept what’s happening. At this stage, people will be thinking ‘Change, what change?’ bury their heads in the sand, and likely to be suffering from anxiety or shock.
2. Anger – Denial and shock quickly turns to anger and frustration as people realise what’s happening isn’t going away, and they’re going to have to deal with it.
3. Insecurity – The ‘How will this affect me?’ stage where worry and fear kicks in.
4. […]

